Usage & AI Activity
See your monthly billing window, per-feature AI usage meters, daily activity charts, and a searchable log of every AI call.
What This Does
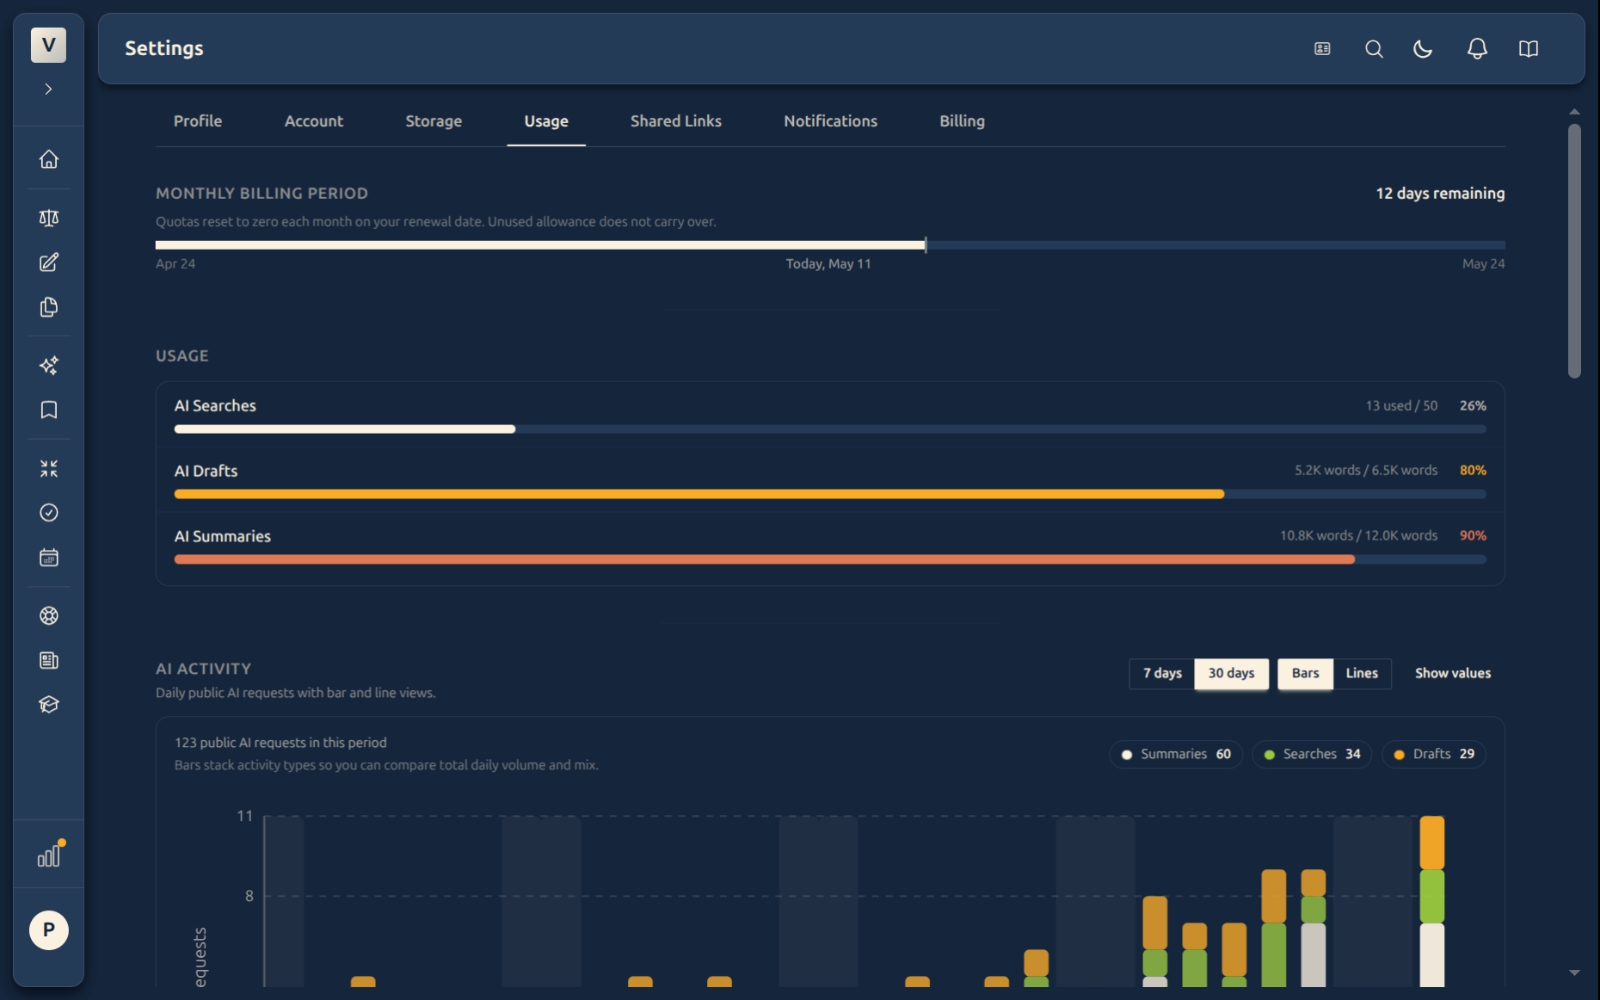
The Usage tab is your AI control panel. It answers three questions: how much of this month’s plan is left, what was the AI used for and when, and which exact calls used it up. Everything resets to zero on the first of each month — unused allowance does not roll over to the next month.
The tab has three sections, top to bottom: a Monthly Billing Period strip, three Usage meter cards (one per feature), and the AI Activity chart with a Recent Activity table below.
Video Walkthrough
Section 1 — Monthly Billing Period and Usage Cards
Monthly Billing Period strip
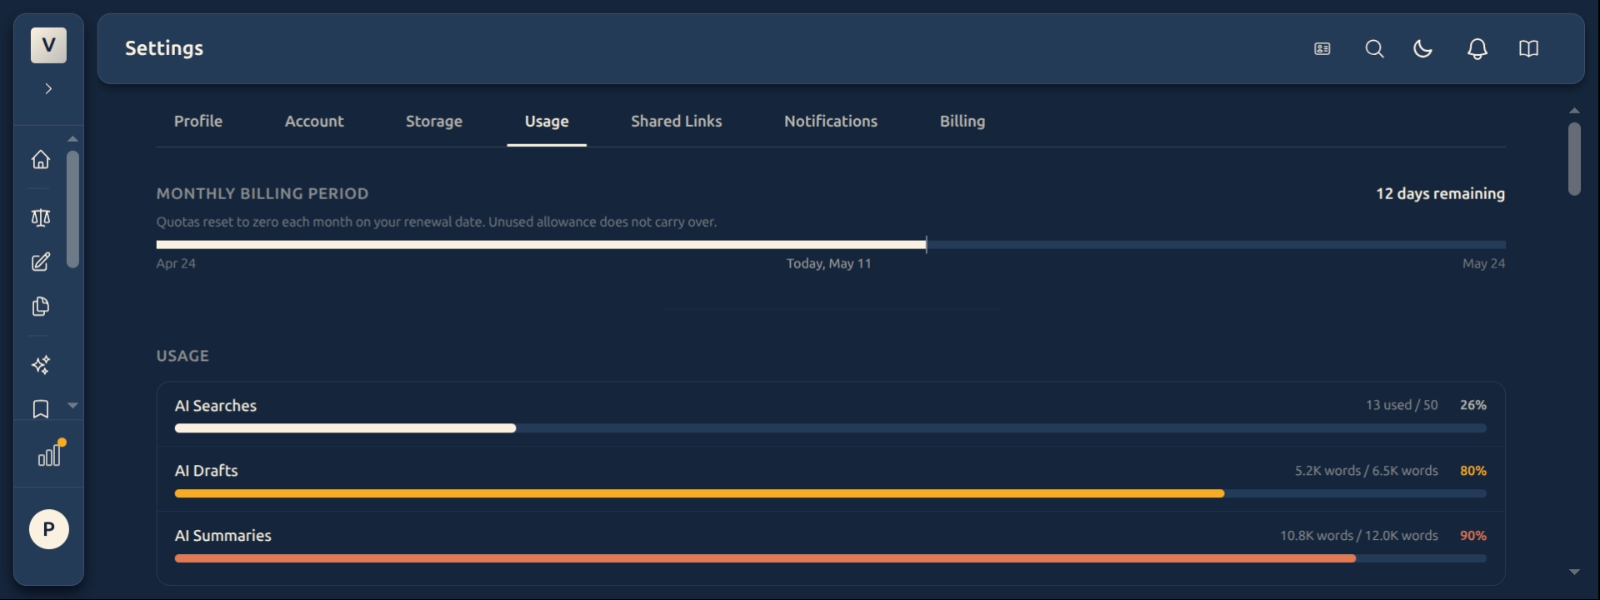
The strip at the top shows where you are in the current billing cycle. The bar fills from left to right as the month progresses, with Apr 24 (period start) on the left, Today marked in the middle, and the renewal date on the right (e.g. May 24). The number on the far right — 12 days remaining — counts down to renewal day, when the meters reset.
Quotas reset to zero each month. There is no carry-over: if you used only half of your AI Drafts allowance in April, you start May with the full allowance, not 1.5×.
Usage meter cards
Below the billing strip, three cards show one progress bar per metered feature:
- AI Searches — number of search queries you have run. Counted as one unit per query, regardless of how long the query is. The label reads
13 used / 50. - AI Drafts — words of AI-drafted content you have generated. Counted from the actual draft text, not from tokens. The label reads
5.2K words / 6.5K words. - AI Summaries — words of AI-generated summary output. Same rule: real words from the produced summary. The label reads
10.8K words / 12.0K words.
The percentage on the right of each bar (26%, 80%, 90%) is used ÷ allowance. The bar tint changes as you approach the limit — cool tones below 75%, warm above. When a meter reaches 100% the relevant action will be blocked until the next reset; you will see a clear error message at that moment, not silent failure.
Chat is not shown as a meter — it just works. It is metered server-side so we can keep the lights on, but as a user you do not need to think about it.
Section 2 — AI Activity Chart
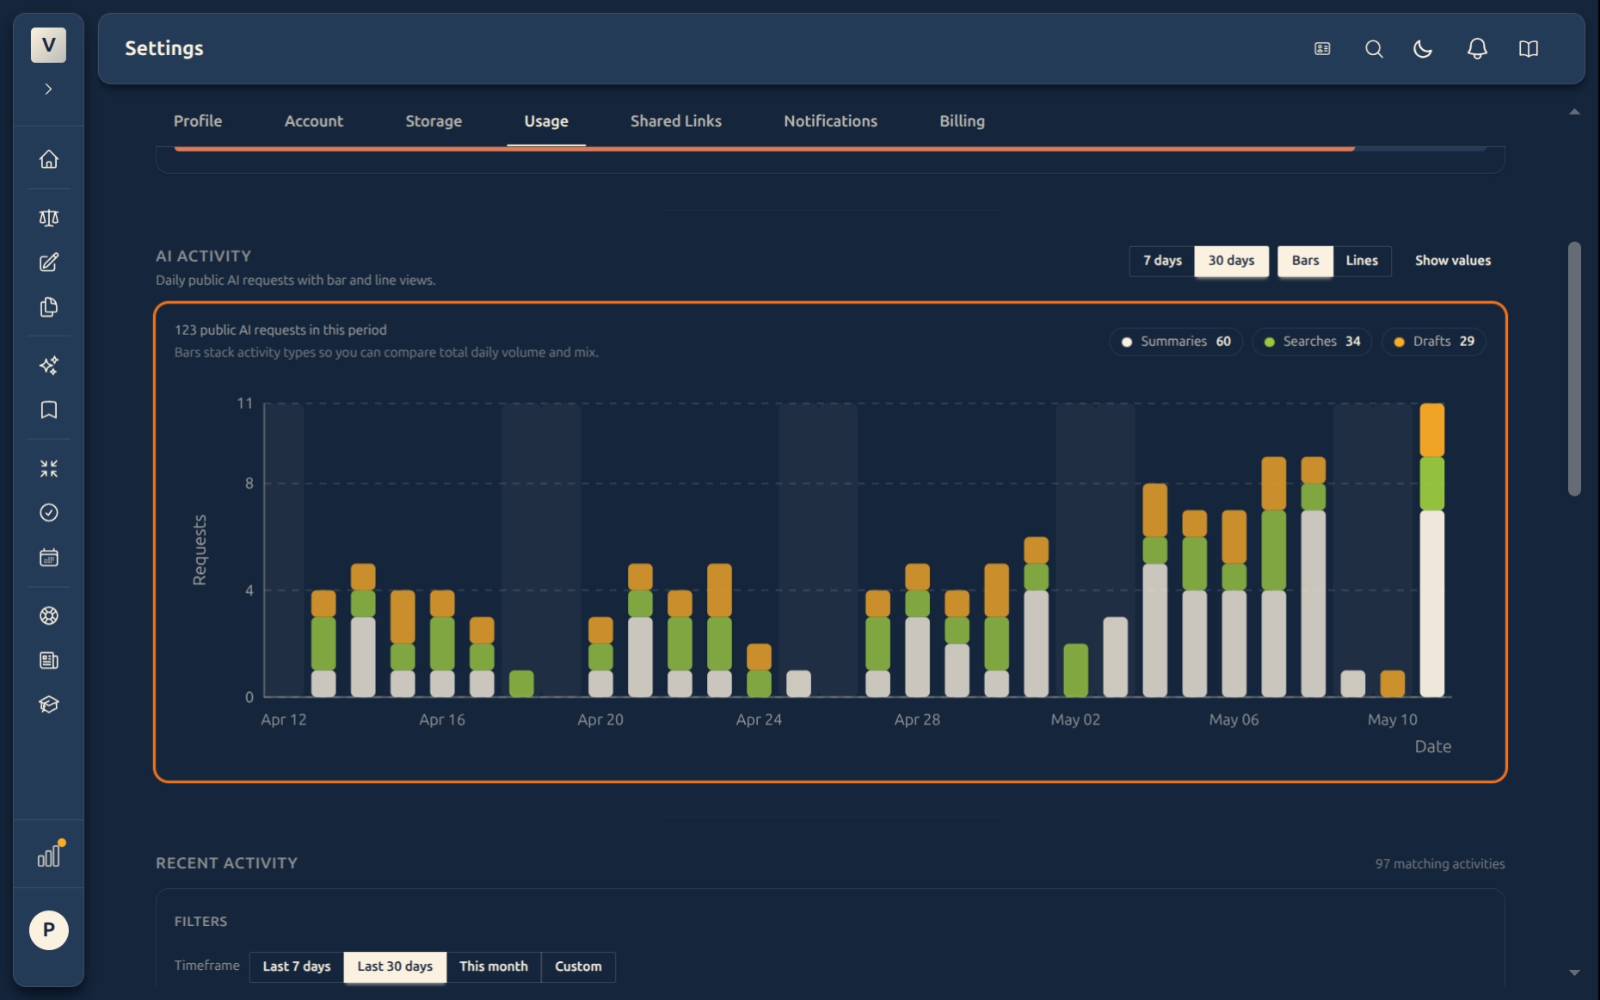
The chart shows your daily AI usage over a selected window, stacked by activity type. Bars are coloured by feature (Summaries, Searches, Drafts) so you can see at a glance whether yesterday’s spend was mostly drafting or mostly searching.
Switching the time window
Two pills at the right of the chart header switch the date range:
- 7 days — the last seven days, ending today. Good for spotting “is something running away today.”
- 30 days — the last thirty days, ending today. Good for seeing the monthly shape.
The currently selected pill is filled. Switching is one click and the URL persists your choice, so a reload preserves the view.
Switching the chart type
The next two pills choose how the data is drawn:
- Bars — each day is a stacked column, with each colour band representing one activity type. Useful for comparing total daily volume and what made it up.
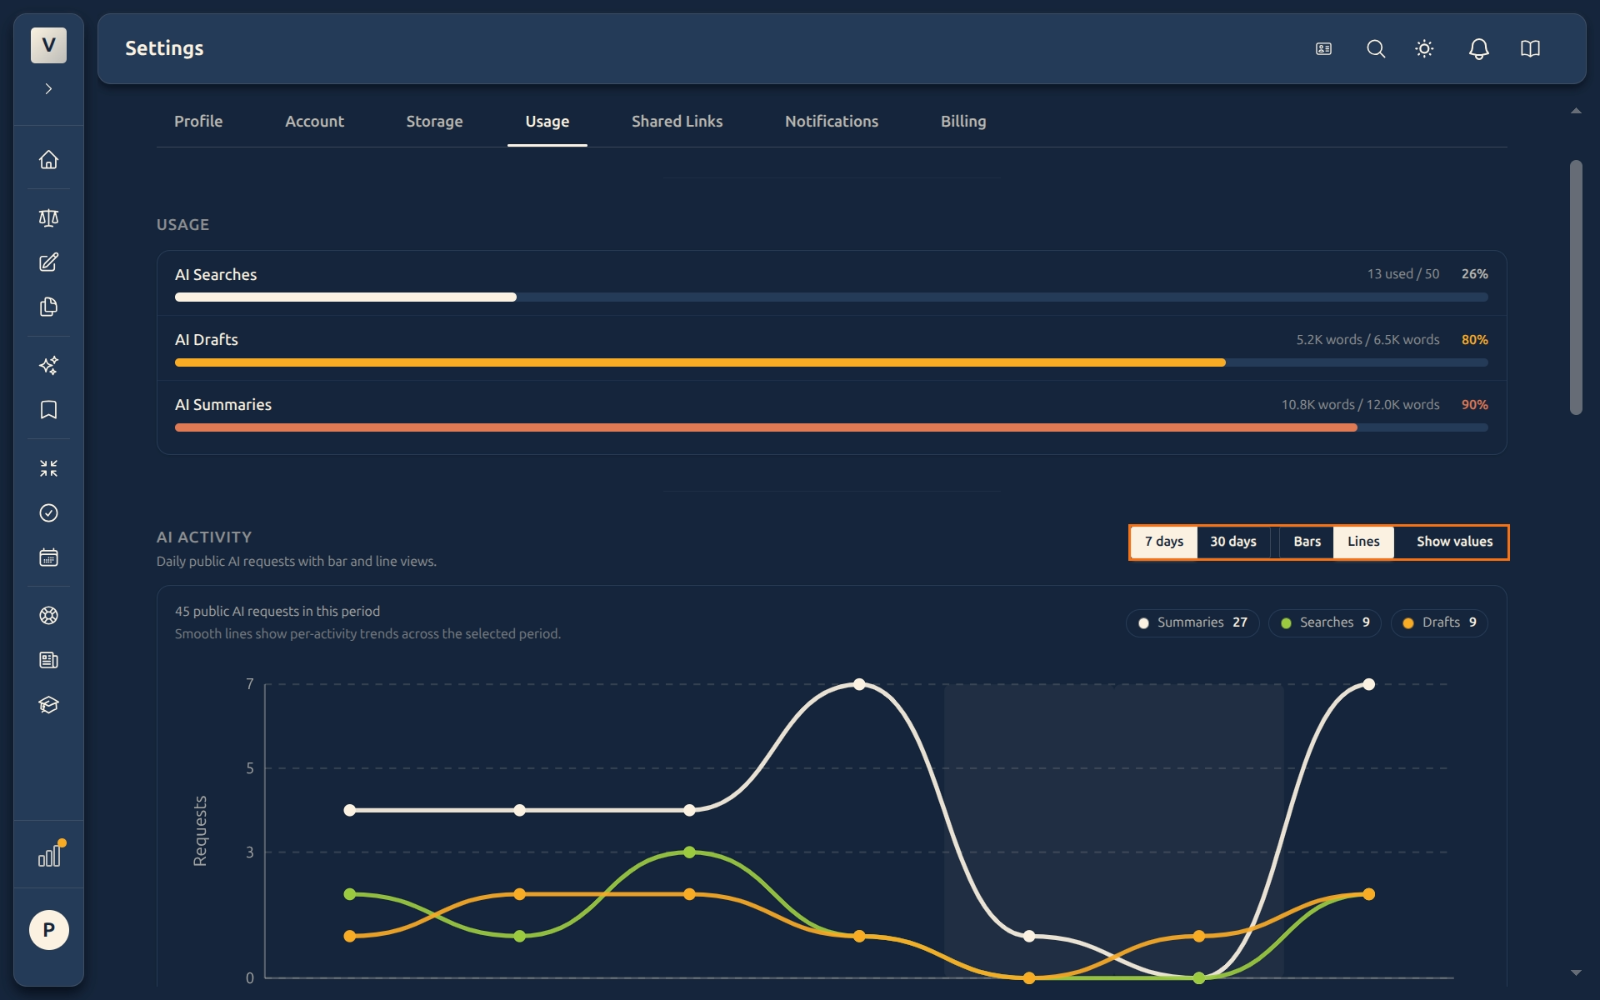
- Lines — one line per activity type. Useful for seeing trends across days when you care about a single feature.
Show values
By default bar heights are read against the Y-axis on the left. Click Show values to print the exact number on top of every bar segment — easier to read than eyeballing the axis. The button label flips to Hide values when on; click again to turn off.
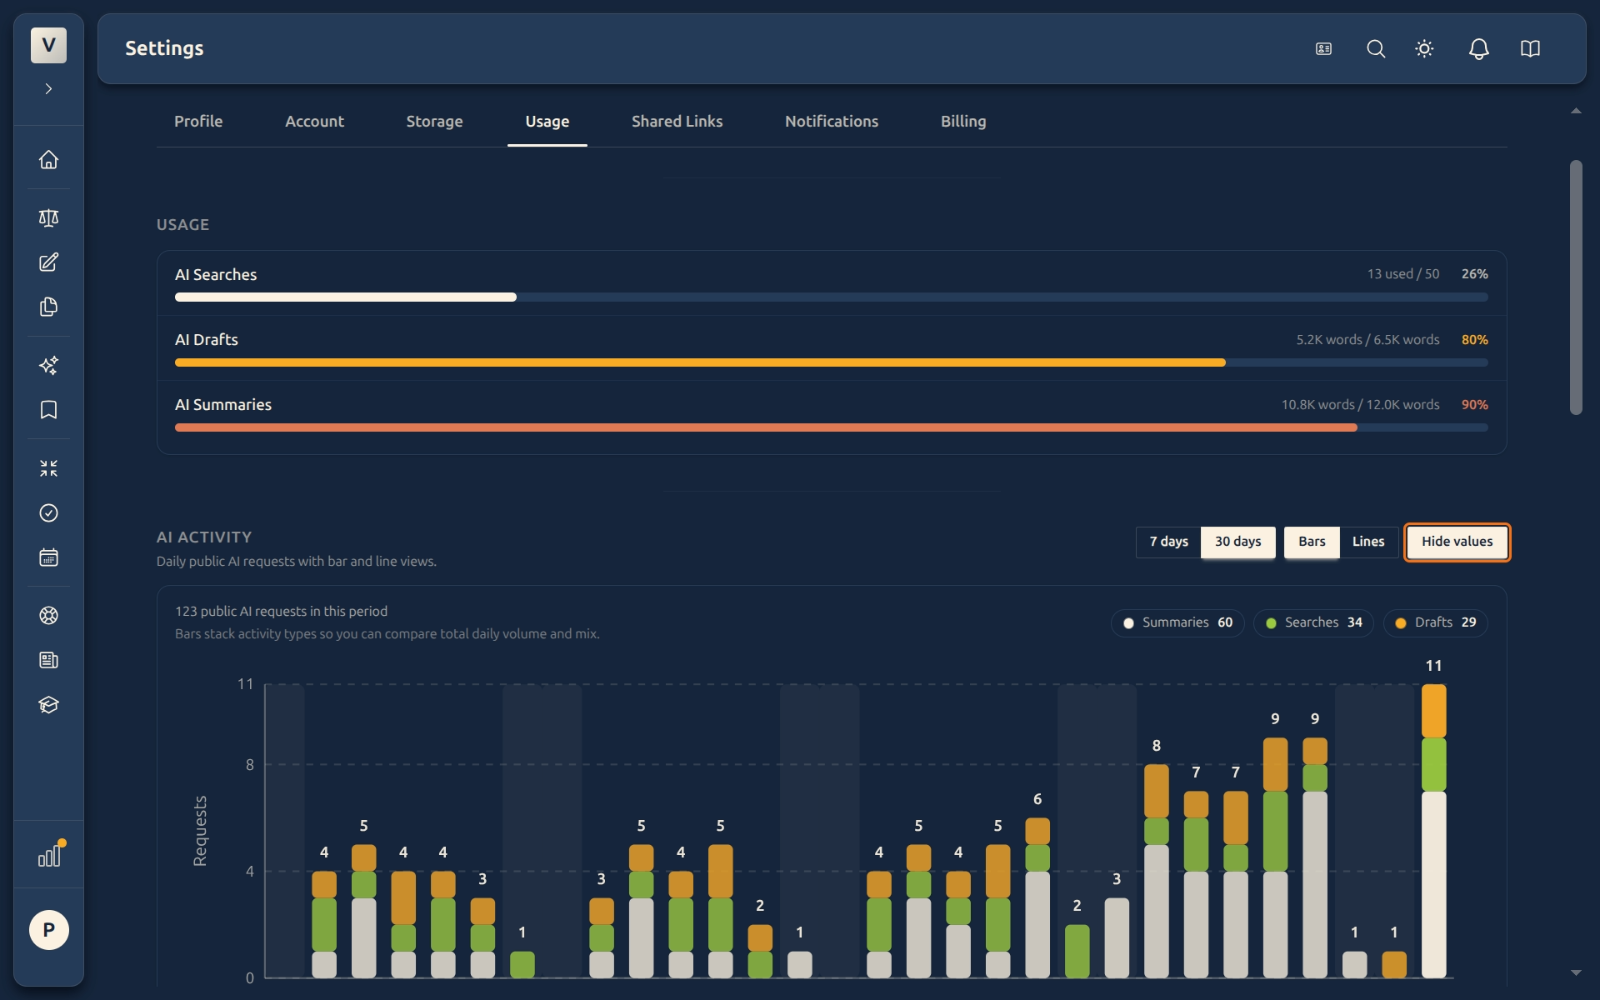
The summary panel at the top-right of the chart (Summaries 60 · Searches 34 · Drafts 29) is a legend, with totals for the visible period.
Weekends are lightly shaded on the chart background so it is easier to see which dips were Saturday/Sunday gaps versus real low-volume weekdays.
Section 3 — Recent Activity Table
The bottom section is a searchable, filterable, sortable log of every AI call your account has made.
Columns
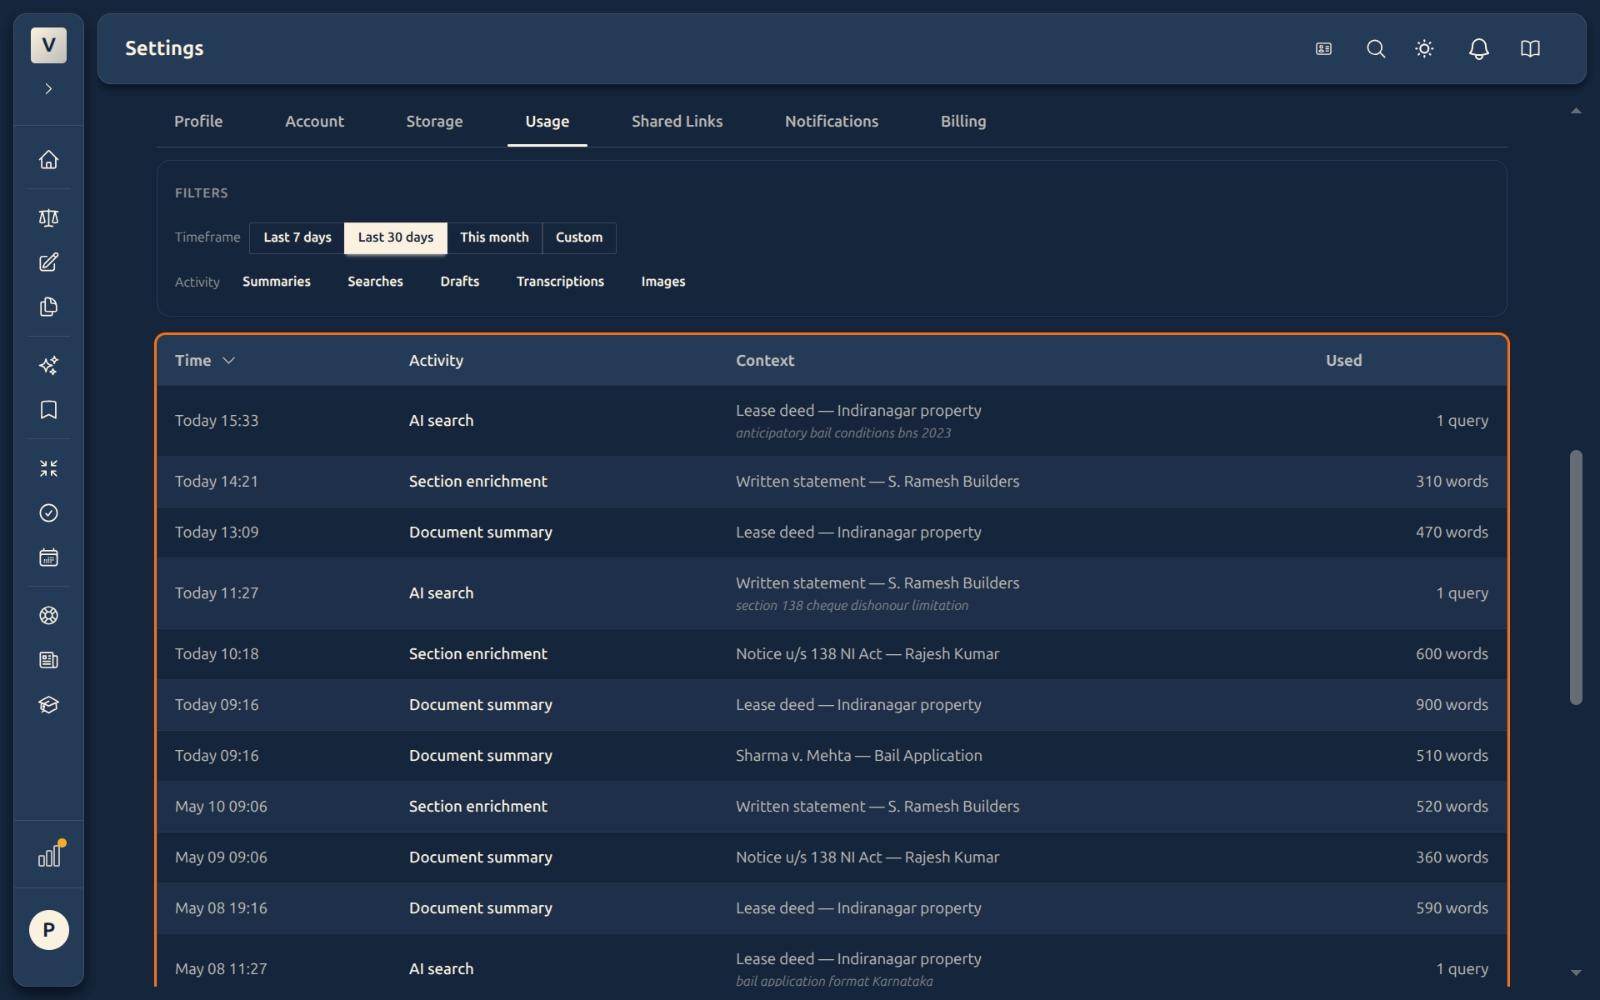
- Time — when the call ran. Today’s entries show
Today HH:MM; older entries showMon DD HH:MM. Click the column header to sort newest-first or oldest-first. - Activity — what kind of call it was: AI search, Document summary, Section enrichment, etc.
- Context — what document or matter the call was for. Real example values:
Lease deed — Indiranagar property,Notice u/s 138 NI Act — Rajesh Kumar,Sharma v. Mehta — Bail Application. A small italic subtitle on rows likeAI searchshows the query you typed. - Used — the unit count this call cost:
1 queryfor searches,470 wordsfor a draft or summary,600 wordsfor a section enrichment.
Filters
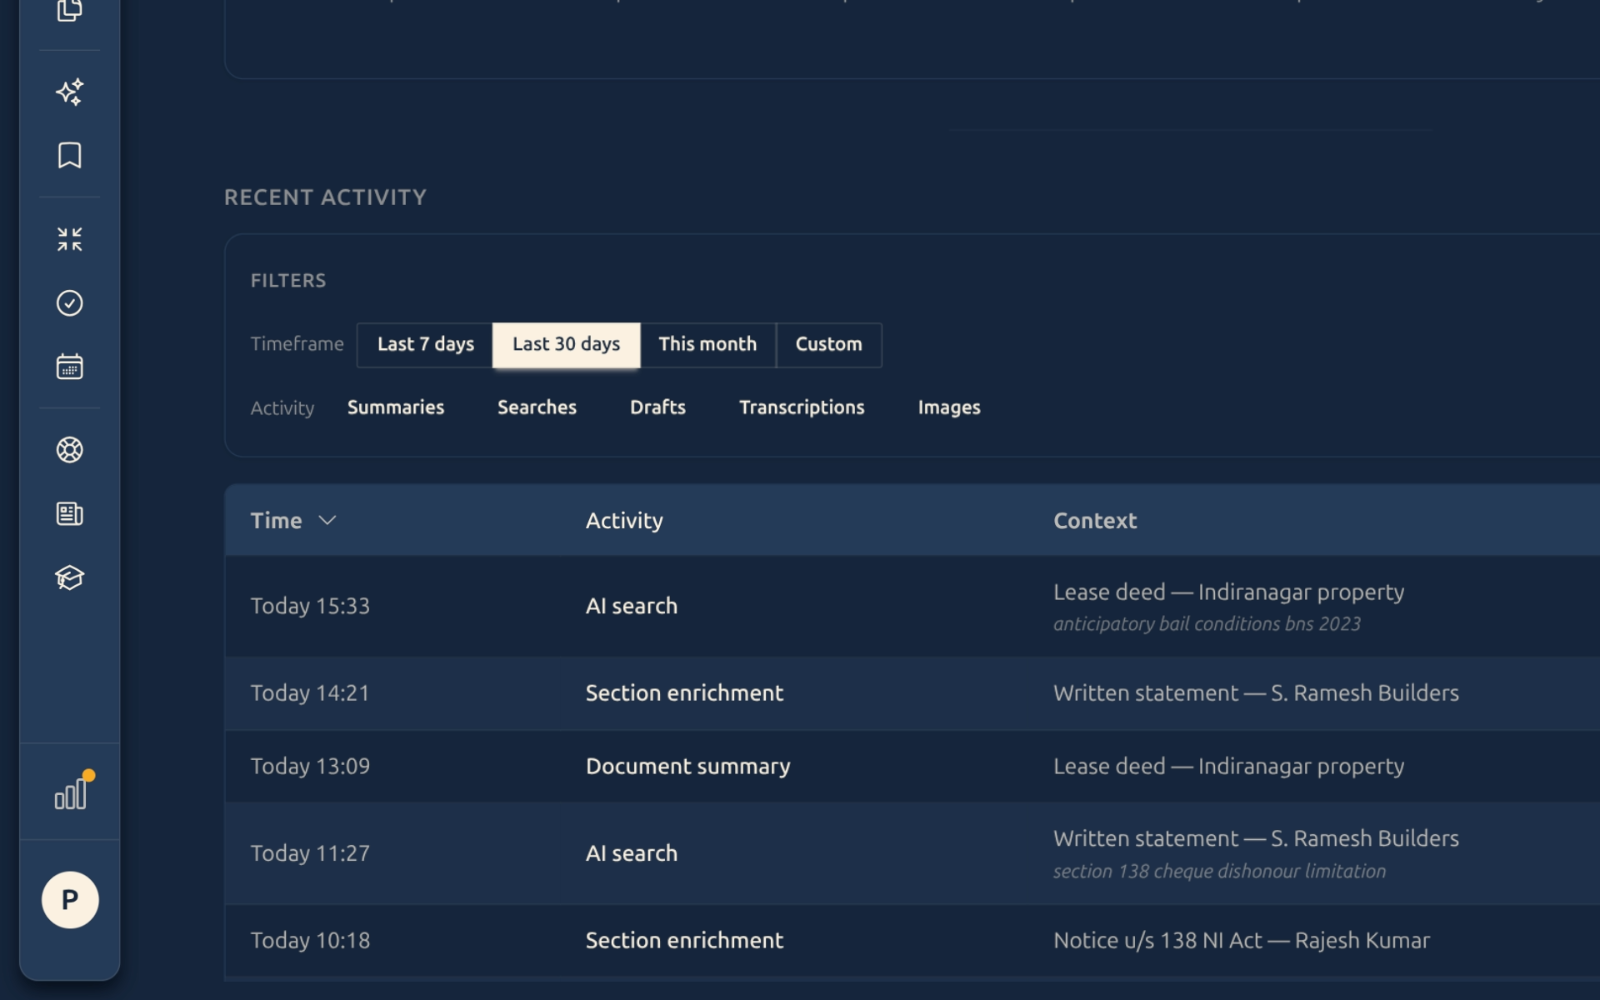
A FILTERS bar sits above the table with two rows of chips:
- Timeframe:
Last 7 days,Last 30 days,This month,Custom. One is always active. Picking a timeframe filters both the table and the activity chart. - Activity:
Summaries,Searches,Drafts,Transcriptions,Images. These are toggle chips — click one to include that type only; click again to remove it; combine multiple to show several types at once. With no chip selected, all types are shown.
When any non-default filter is active, a Clear filters link appears at the far right of the FILTERS bar; one click resets everything back to the last 30 days, all types.
Sorting
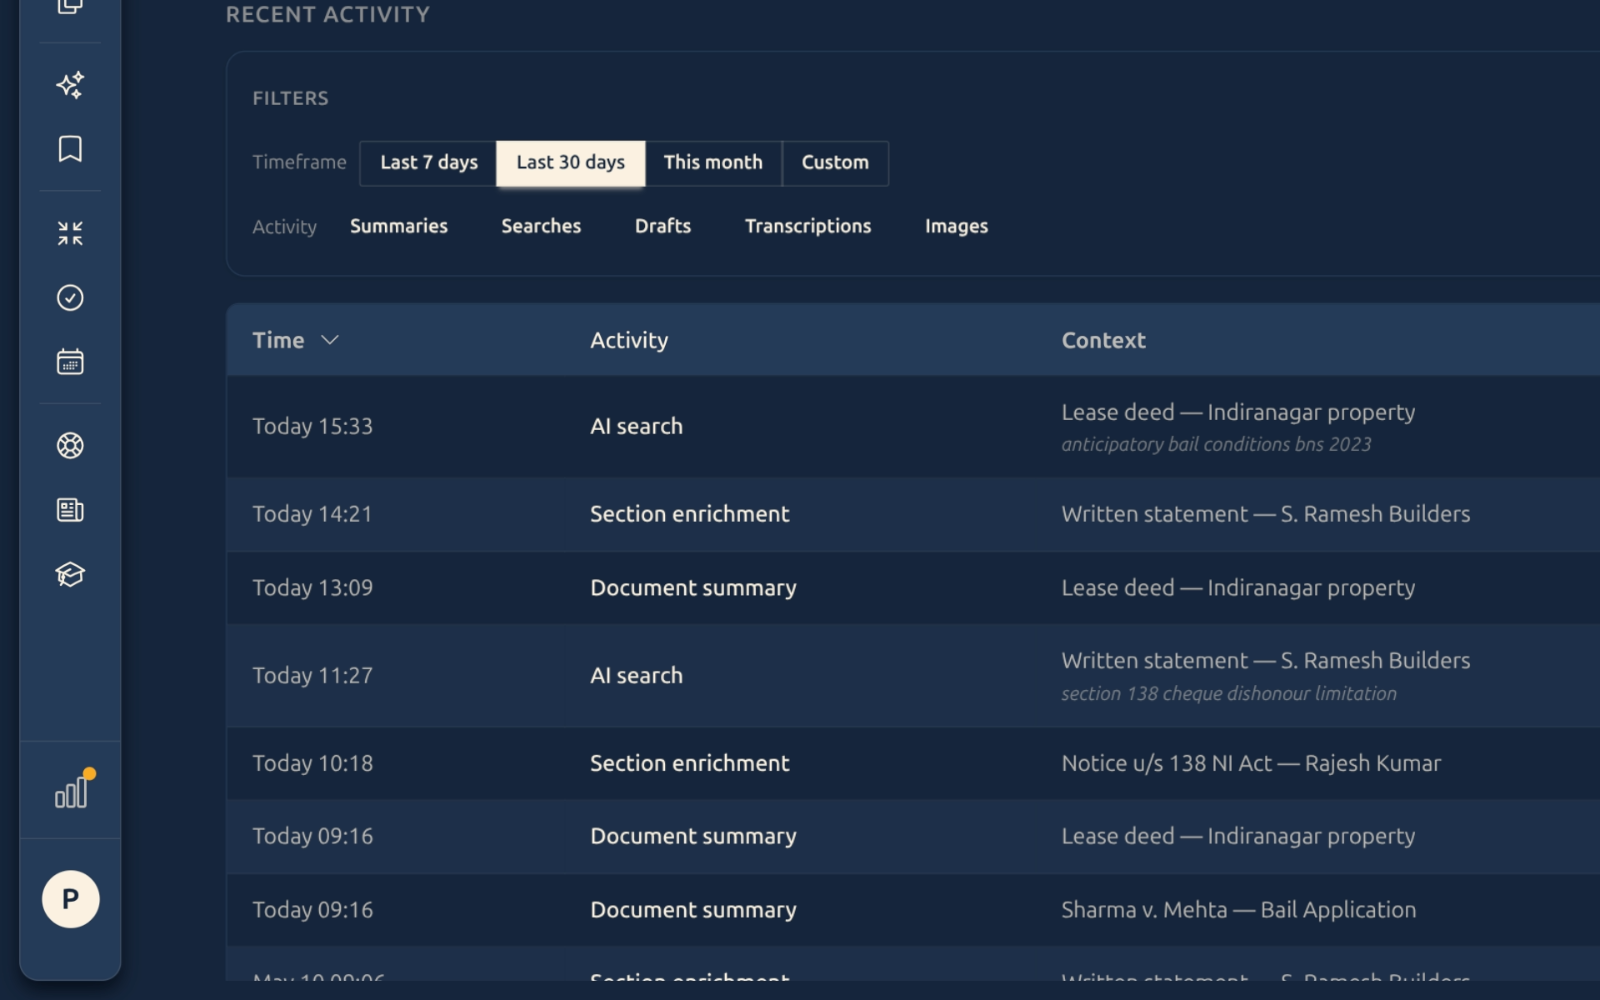
Click any column header to sort the table by that column. A small chevron (⌄) appears beside the active column to show the current sort direction; click again to flip ascending ↔ descending. The default is Time, newest first.
Pagination
The table shows 20 rows per page. A pager at the foot of the table (visible after you scroll) shows the current page and lets you jump back and forward. The text 97 matching activities next to the section heading tells you the total count for the current filter.
Custom date range
Picking Custom in the Timeframe row opens an inline panel with two date pickers — From date and To date — and an Apply button. Pick any two dates (the To date must be on or after From), click Apply, and both the chart and the table redraw for that exact window.
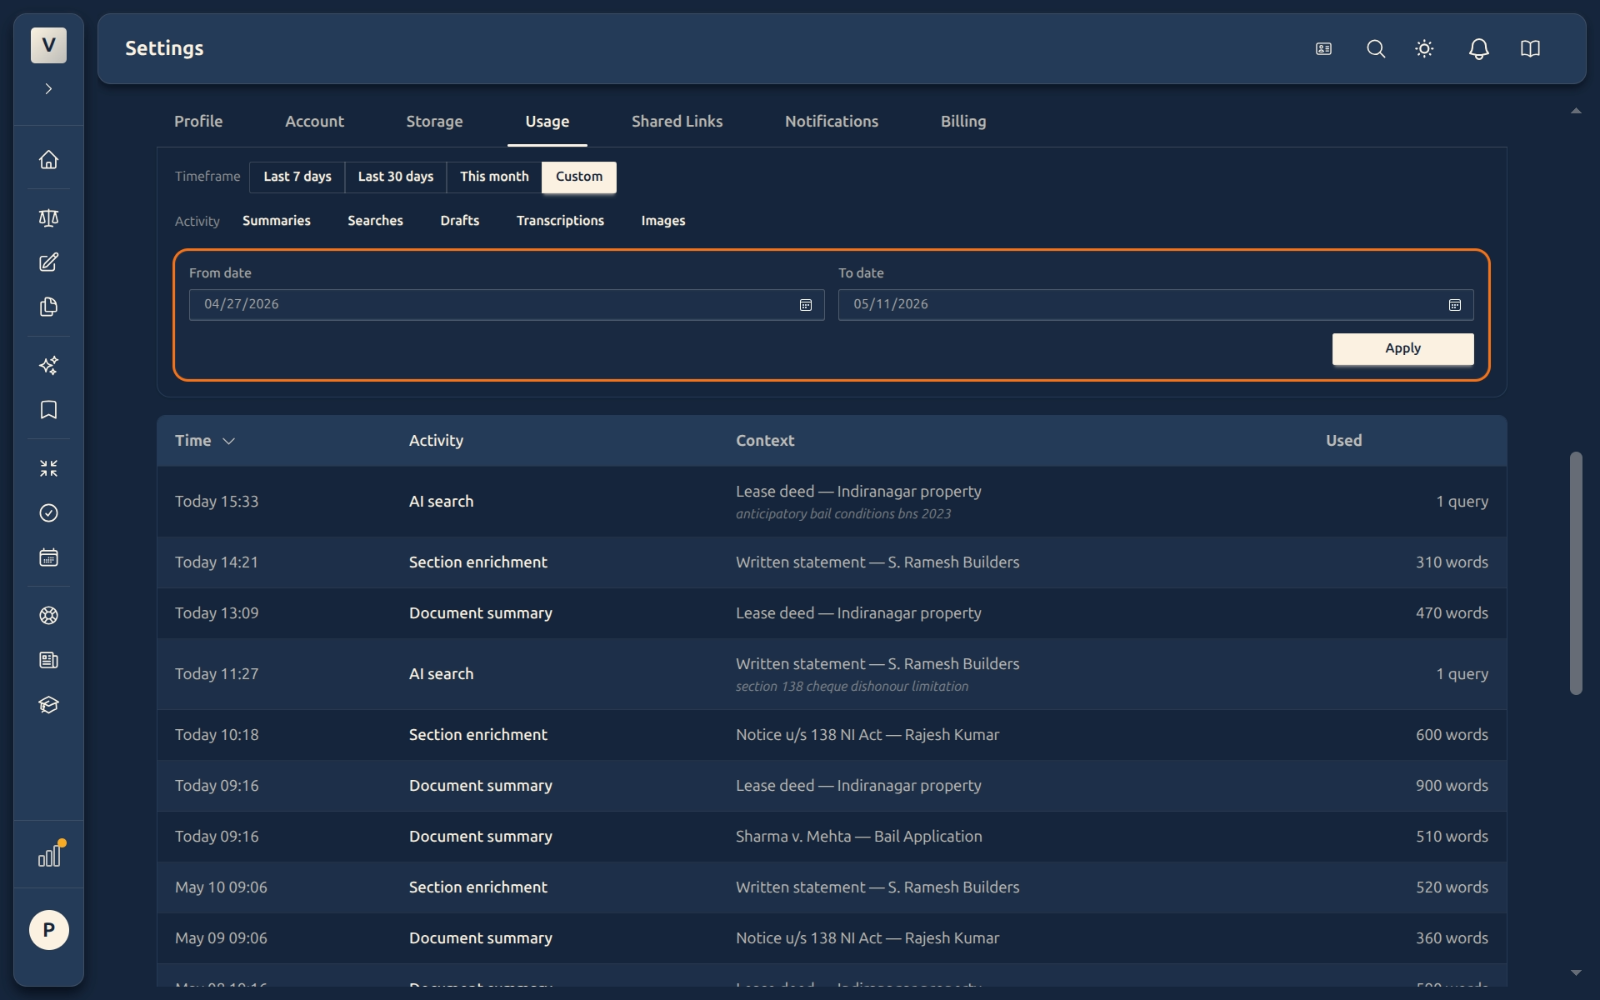
Switching back to one of the preset chips clears the custom range.
FAQ
Does unused allowance roll over to next month?
No. Quotas reset to zero on your renewal date each month. If you used only half of your AI Drafts allowance in April, you start May with the full allowance again, not 1.5×. Plan your heavy-drafting days accordingly.
Why is AI Summaries counted in words but AI Searches in queries?
Because the cost shape is different. A search is one query no matter how it is phrased, so we count queries. A summary’s cost scales with how much text we produce, so we count the words in the produced summary. Same goes for drafts. All counts come from the actual generated text — never from token estimates.
What if I hit 100% on one of my meters?
That feature is paused for the rest of the cycle. You will see a clear error at the moment you try the next call, not silent failure. Other features keep working — running out of summaries does not block drafting or search.
Why don’t I see a chat meter?
Chat just works — we do not show a meter or quota for it. If you are doing very heavy chat usage we may rate-limit briefly to keep the service healthy, but for normal use you will never see a limit.
Can I see how much an individual call cost?
Yes — the Used column on every row of the Recent Activity table is the exact unit count for that call. Click a column to sort and you can find your biggest spenders. The total cost in money is not shown — you are billed by the plan, not by the call.
Examples of when you’d open this tab:
- Advocate Priya Sharma is drafting a long reply and wants to check whether she has enough word allowance left before starting.
- Advocate Arjun Mehta got a “limit reached” message on a search and wants to see when his cycle resets.
- A senior in the firm wants to know whether AI Summaries is being used heavily this month before approving a plan upgrade.
See Also
- Storage & Files — your file upload quota, separate from AI usage.
- Billing — your current plan, payment method, and upgrade options.